We are clearly living in an era where data is crucial and significant. When I refer to data, I mean big data. Throughout history, various factors have defined powerful individuals, such as wealth, military strength, and loyal followers. In today’s context, I believe that those who have access to big data can be considered leaders. We are currently in an AI era that permeates our daily lives, highlighting the importance of data more than ever before.

If you enjoy math and statistics, working with data can be a fulfilling experience. You can derive various insights from it, depending on your perspective. Each individual can have a unique understanding of data analysis, highlighting the significance of data that cannot be overlooked.

For instance, if you are working on a scientific research project aimed at finding a treatment for a specific type of cancer, you likely recognize the critical role that data plays in your work. Accessing the records of millions of people who have faced that particular cancer can provide valuable insights to help guide your project more effectively.

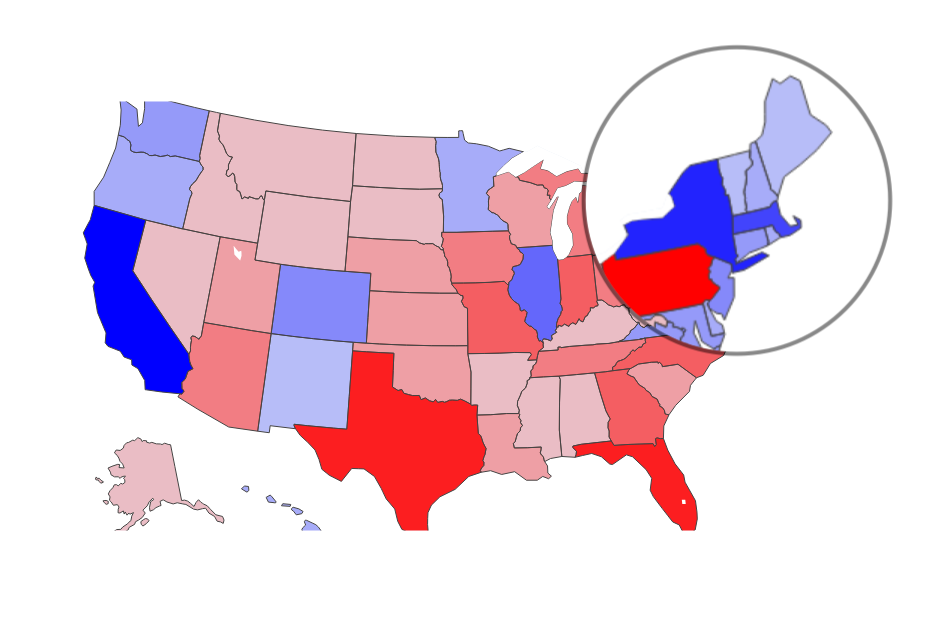
Considering the aforementioned preamble, I want to address my curiosity about the US presidential election in 2024. I’ve often heard that states with a higher number of universities tend to lean towards the Democratic Party. To explore this idea, I decided to create both a choropleth map and a bar chart for visualization. Plotly Graphing Libraries offers a variety of excellent tools for creating visualizations and diagrams.

First, I extracted the latest updates of the USA 2024 presidential election for each county and state. You can access it in the this GitHub repository.

I compiled a list of the top U.S. universities based on the QS ranking from universityrankings.ch. To enhance this data, I need to add new columns for each university, including their states, the number of graduate and undergraduate students (to indicate the size of the university), and the percentage of domestic students. For this information, I referred to the API provided by the U.S. Department of Education. This API offers valuable data on all U.S. universities and colleges. I extracted the total number of students and the percentage of U.S.-born students from it.

The final stage involves data cleaning and data engineering to prepare the data for visualization. Since I am not proficient in data engineering, I received support from Clause, which provided me with the necessary code to obtain the final dataset before visualizing it.

Now you can see the results (To see the details, save the picture). The darker the color, the more top universities are found in that state. It appears that states with the best universities tend to lean more toward the Democratic Party. However, some states have shifted towards the Republican Party in recent elections. This suggests that we cannot apply the general trend observed in previous elections with complete certainty to the recent one.

In this analysis, I examine two different visual representations of data. The first visualization considers the number of domestic students at each university as a weight, reflecting the size of the university, when calculating the total number of universities per state. The second visualization, on the other hand, does not take university size into account. Both diagrams are illustrated below. It is clear that the size of the universities can significantly impact the results.

USA 2024 presidential election Vs Top US Universities and their size

USA 2024 presidential election Vs Top US Universities and their size

USA 2024 presidential election Vs Top US Universities without considering their size

USA 2024 presidential election Vs Top US Universities without considering their size

Certainly, by incorporating additional factors and visualizing them, you might derive different interpretations. Therefore, in data analysis, it is crucial to wisely select the parameters and entries.

You can look at the code and the university data below.

no world_rank institution city state student_size student_grad home_ZIP total_student domestic
1 1 Massachusetts Institute of Technology - MIT Cambridge Massachusetts 4638 7201 0.82 11839 9707
2 4 Harvard University Cambridge Massachusetts 7973 21263 0.81 29236 23681
3 6 Stanford University Stanford California 7761 10234 0.80 17995 14396
4 10 California Institute of Technology - Caltech Pasadena California 982 1419 0.79 2401 1896
5 11 University of Pennsylvania Philadelphia Pennsylvania 10572 16951 0.85 27523 23394
6 12 University of California - Berkeley Berkeley California 32475 12828 0.72 45303 32618
7 16 Cornell University Ithaca New York 15676 10163 0.84 25839 21704
8 21 University of Chicago Chicago Illinois 7511 10744 0.85 18255 15516
9 22 Princeton University Princeton New Jersey 5527 3238 0.84 8765 7362
10 23 Yale University New Haven Connecticut 6639 8131 0.83 14770 12259
11 32 Johns Hopkins University Baltimore Maryland 5643 25231 0.86 30874 26551
12 34 Columbia University New York New York 8902 25880 0.78 34782 27129
13 42 University of California - Los Angeles Los Angeles California 32423 14007 0.68 46430 31572
14 43 New York University New York New York 29136 29743 0.79 58879 46514
15 44 University of Michigan - Ann Arbor Ann Arbor Michigan 32448 18530 0.90 50978 45880
16 50 Northwestern University Evanston Illinois 8837 14168 0.85 23005 19554
17 58 Carnegie Mellon University Pittsburgh Pennsylvania 7005 8943 0.85 15948 13555
18 61 Duke University Durham North Carolina 6570 11383 0.87 17953 15619
19 66 University of Texas at Austin Austin Texas 40980 11075 0.85 52055 44246
20 69 University of Illinois at Urbana-Champaign Champaign Illinois 34031 21796 0.88 55827 49127
21 72 University of California - San Diego La Jolla California 33092 8910 0.71 42002 29821
22 76 University of Washington Seattle Washington 30931 16106 0.86 47037 40451
23 79 Brown University Providence Rhode Island 7222 3550 0.84 10772 9048
24 89 Purdue University West Lafayette Indiana 38438 12935 0.94 51373 48290
25 89 Pennsylvania State University University Park Pennsylvania 7798 5769 0.93 13567 12617
26 108 Boston University Boston Massachusetts 17668 18255 0.84 35923 30175
27 114 Georgia Institute of Technology Atlanta Georgia 17379 26881 0.89 44260 39391
28 116 University of Wisconsin-Madison Madison Wisconsin 35184 12650 0.94 47834 44963
29 125 University of Southern California Los Angeles California 20505 28246 0.74 48751 36075
30 130 University of California - Davis Davis California 31512 8147 0.74 39659 29347
31 141 Rice University Houston Texas 4480 4178 0.85 8658 7359
32 152 Michigan State University East Lansing Michigan 39021 10822 0.93 49843 46353
33 154 Texas A&M University College Station Texas 56792 16502 0.88 73294 64498
34 155 University of North Carolina at Chapel Hill Chapel Hill North Carolina 19921 11676 0.92 31597 29069
35 176 Washington University in St. Louis Saint Louis Missouri 7801 8880 0.89 16681 14846
36 178 University of California - Santa Barbara Santa Barbara California 23419 2961 0.74 26380 19521
37 196 Emory University Atlanta Georgia 7017 7740 0.87 14757 12838
38 200 Arizona State University Tempe Arizona 64778 14573 0.87 79351 69035
39 203 University of Minnesota - Twin Cities Minneapolis Minnesota 30560 15707 0.93 46267 43028
40 208 Ohio State University Columbus Ohio 45140 14417 0.95 59557 56579
41 215 University of Florida Gainesville Florida 33673 20659 0.82 54332 44552
42 218 University of Maryland at College Park College Park Maryland 29982 10439 0.84 40421 33953
43 236 University of Rochester Rochester New York 6569 5430 0.88 11999 10559
44 243 Dartmouth College Hanover New Hampshire 4412 2286 0.85 6698 5693
45 248 Vanderbilt University Nashville Tennessee 7144 6559 0.90 13703 12332
46 259 Case Western Reserve University Cleveland Ohio 5927 6184 0.92 12111 11142
47 275 University of Massachusetts - Amherst Amherst Massachusetts 24111 7838 0.88 31949 28115
48 275 University of Pittsburgh Pittsburgh Pennsylvania 19954 9347 0.96 29301 28128
49 293 University of Arizona Tucson Arizona 37979 10652 0.86 48631 41822
50 297 University of Virginia Charlottesville Virginia 17103 8638 0.89 25741 22909
51 301 Georgetown University Washington District of Columbia 7343 13084 0.83 20427 16954
52 307 University of California - Irvine Irvine California 28651 7275 0.69 35926 24788
53 311 North Carolina State University Raleigh North Carolina 25109 10446 0.93 35555 33066
54 316 University of Notre Dame Notre Dame Indiana 8917 4134 0.90 13051 11745
55 320 University of Colorado at Boulder Boulder Colorado 30598 8551 0.90 39149 35234
56 324 University of Miami Coral Gables Florida 12215 6898 0.72 19113 13761
57 328 Rutgers - The State University of New Jersey New Brunswick New Jersey 34929 10433 0.87 45362 39464
58 344 Tufts University Medford Massachusetts 6747 6616 0.85 13363 11358
59 355 Indiana University at Bloomington Bloomington Indiana 35401 11345 0.94 46746 43941
60 365 University of Illinois at Chicago Chicago Illinois 21567 11940 0.79 33507 26470
61 371 George Washington University Washington District of Columbia 10798 14457 0.85 25255 21466
62 389 Virginia Polytechnic Institute and State University Blacksburg Virginia 30339 7736 0.91 38075 34648
63 393 University of California - Santa Cruz Santa Cruz California 17502 1976 0.75 19478 14608
64 396 Northeastern University Boston Massachusetts 16172 13711 0.87 29883 25998
65 413 Yeshiva University New York New York 2820 3190 0.71 6010 4267
66 442 Colorado State University Fort Collins Colorado 25150 7626 0.92 32776 30153
67 452 University of Kansas Lawrence Kansas 18539 7467 0.94 26006 24445
68 460 State University of New York at Stony Brook Stony Brook New York 17406 8201 0.74 25607 18949
69 466 State University of New York at Buffalo Buffalo New York 20569 11338 0.88 31907 28078
70 466 Washington State University Pullman Washington 22265 4927 0.90 27192 24472
71 470 Iowa State University Ames Iowa 24994 4728 0.96 29722 28533
72 481 University of Tennessee - Knoxville Knoxville Tennessee 26905 6766 0.96 33671 32324
73 488 University of Hawaii at Manoa Honolulu Hawaii 13915 4876 0.82 18791 15408
74 497 University of California - Riverside Riverside California 22842 3898 0.70 26740 18718
75 501 Colorado School of Mines Golden Colorado 5662 1689 0.92 7351 6762
76 506 University of Delaware Newark Delaware 18665 4557 0.90 23222 20899
77 527 Missouri University of Science and Technology Rolla Missouri 5453 1582 0.96 7035 6753
78 531 University of Utah Salt Lake City Utah 25392 8379 0.91 33771 30731
79 565 University of Connecticut Storrs Connecticut 18768 8020 0.88 26788 23573
80 573 Florida State University Tallahassee Florida 32691 11225 0.85 43916 37328
81 574 Florida International University Miami Florida 39277 9921 0.52 49198 25582
82 587 University of Georgia Athens Georgia 30566 9893 0.91 40459 36817
83 596 University of Iowa Iowa City Iowa 21545 8042 0.94 29587 27811
84 596 University of Texas at Dallas Richardson Texas 21586 9953 0.84 31539 26492
85 601-610 Illinois Institute of Technology Chicago Illinois 2877 3818 0.84 6695 5623
86 601-610 Rensselaer Polytechnic Institute Troy New York 5886 1066 0.89 6952 6187
87 601-610 University of South Carolina Columbia South Carolina 26840 8310 0.95 35150 33392
88 621-630 University of South Florida Tampa Florida 36763 11553 0.86 48316 41551
89 631-640 Tulane University New Orleans Louisiana 8490 5242 0.90 13732 12358
90 631-640 Boston College Chestnut Hill Massachusetts 9751 5305 0.85 15056 12797
91 641-650 University of Missouri - Columbia Columbia Missouri 23206 7559 0.96 30765 29534
92 641-650 Oregon State University Corvallis Oregon 28407 5387 0.91 33794 30752
93 641-650 Lehigh University Bethlehem Pennsylvania 5612 1770 0.89 7382 6569
94 651-660 University of Houston Houston Texas 37080 8757 0.80 45837 36669
95 661-670 City University of New York "New York New York 2666 5940 0.68 8606 5852
96 681-690 Temple University Philadelphia Pennsylvania 23697 9090 0.89 32787 29180
97 701-710 University of Nebraska - Lincoln Lincoln Nebraska 19097 4616 0.95 23713 22527
98 701-710 Stevens Institute of Technology Hoboken New Jersey 4054 5244 0.80 9298 7438
99 701-710 University of Oklahoma Norman Oklahoma 20842 7026 0.93 27868 25917
100 711-720 American University Washington D.C. District of Columbia 7582 3735 0.87 11317 9845
101 721-730 Brandeis University Waltham Massachusetts 3675 1894 0.83 5569 4622
102 721-730 Drexel University Philadelphia Pennsylvania 13933 8323 0.89 22256 19807
103 741-750 University of Central Florida Orlando Florida 57874 9684 0.84 67558 56748
104 741-750 Wake Forest University Winston-Salem North Carolina 5446 3516 0.91 8962 8155
105 761-770 University of Colorado at Denver Denver Colorado 10922 9689 0.90 20611 18549
106 761-770 University of Cincinnati Cincinnati Ohio 27880 11492 0.96 39372 37797
107 771-780 University of Maryland Baltimore County Baltimore Maryland 10557 3366 0.88 13923 12252
108 781-790 The New School New York New York 7136 2937 0.79 10073 7957
109 781-790 Texas Tech University Lubbock Texas 32346 7799 0.91 40145 36531
110 791-800 University of Kentucky Lexington Kentucky 22115 8812 0.96 30927 29689
111 791-800 Wayne State University Detroit Michigan 15669 7672 0.91 23341 21240
112 791-800 New Jersey Institute of Technology Newark New Jersey 8365 3313 0.74 11678 8641
113 791-800 University of New Mexico Albuquerque New Mexico 15642 5578 0.93 21220 19734
114 801-850 University of Alaska - Fairbanks Fairbanks Alaska 4010 971 0.93 4981 4632
115 801-850 Syracuse University Syracuse New York 15071 7277 0.86 22348 19219
116 801-850 University of Oregon Eugene Oregon 19443 3598 0.91 23041 20967
117 851-900 Georgia State University Atlanta Georgia 28439 7592 0.89 36031 32067
118 851-900 Kansas State University Manhattan Kansas 14762 4676 0.95 19438 18466
119 851-900 University of Mississippi University Mississippi 17157 4998 0.97 22155 21490
120 851-900 Clarkson University Potsdam New York 2587 1051 0.94 3638 3419
121 851-900 University at Albany SUNY Albany New York 12175 4394 0.86 16569 14249
122 851-900 Oklahoma State University Stillwater Oklahoma 20362 4586 0.95 24948 23700
123 851-900 Swarthmore College Swarthmore Pennsylvania 1619 0.84 1619 1359
124 851-900 Virginia Commonwealth University Richmond Virginia 20552 7124 0.91 27676 25185
125 901-950 Louisiana State University Baton Rouge Louisiana 27729 6396 0.95 34125 32418
126 901-950 Worcester Polytechnic Institute Worcester Massachusetts 5146 2062 0.90 7208 6487
127 901-950 Michigan Technological University Houghton Michigan 5633 1364 0.96 6997 6717
128 901-950 University of Alabama at Birmingham Birmingham Alabama 12776 8607 0.97 21383 20741
129 951-1000 University of Denver Denver Colorado 5986 7583 0.90 13569 12212
130 951-1000 Clark University Worcester Massachusetts 2363 1381 0.88 3744 3294
131 951-1000 Saint Louis University St. Louis, Missouri 7332 5093 0.94 12425 11679
132 951-1000 Clemson University Clemson South Carolina 22467 5900 0.95 28367 26948
133 951-1000 University of Alabama Tuscaloosa Alabama 31360 6186 0.96 37546 36044
134 951-1000 Auburn University Auburn Alabama 25234 6385 0.95 31619 30038
135 1001-1200 Northern Arizona University Flagstaff Arizona 23090 4882 0.89 27972 24895
136 1001-1200 University of Arkansas at Fayetteville Fayetteville Arkansas 22600 3680 0.96 26280 25228
137 1001-1200 San Diego State University San Diego California 31810 5208 0.76 37018 28133
138 1001-1200 Howard University Washington District of Columbia 9243 3077 0.84 12320 10348
139 1001-1200 University of Idaho Moscow Idaho 7120 2698 0.94 9818 9228
140 1001-1200 Loyola University of Chicago Chicago Illinois 11626 5196 0.83 16822 13962
141 1001-1200 Indiana University-Purdue University of Indianapolis Indianapolis Indiana 0.94 0 0
142 1001-1200 University of Louisville Louisville Kentucky 13822 6096 0.96 19918 19121
143 1001-1200 University of Massachusetts at Boston Boston Massachusetts 11749 3365 0.79 15114 11940
144 1001-1200 Mississippi State University Mississippi State Mississippi 18154 4344 0.98 22498 22048
145 1001-1200 University of Missouri - Kansas City Kansas City Missouri 6479 5524 0.95 12003 11402
146 1001-1200 University of New Hampshire Durham New Hampshire 11396 2441 0.94 13837 13006
147 1001-1200 Fordham University Bronx New York 9843 6458 0.78 16301 12714
148 1001-1200 Rochester Institute of Technology Rochester New York 13152 2675 0.91 15827 14402
149 1001-1200 Binghamton University Vestal New York 14398 3910 0.80 18308 14646
150 1001-1200 University of North Carolina at Charlotte Charlotte North Carolina 23063 6090 0.92 29153 26820
151 1001-1200 Kent State University Kent Ohio 9179 5436 0.97 14615 14176
152 1001-1200 Ohio University Athens Ohio 17611 6032 0.97 23643 22933
153 1001-1200 University of Toledo Toledo Ohio 10787 3580 0.96 14367 13792
154 1001-1200 University of Tulsa Tulsa Oklahoma 2612 1122 0.93 3734 3472
155 1001-1200 University of Rhode Island Kingston Rhode Island 13828 2705 0.88 16533 14549
156 1001-1200 Baylor University Waco Texas 15134 5496 0.88 20630 18154
157 1001-1200 Southern Methodist University Dallas Texas 7044 4997 0.85 12041 10234
158 1001-1200 University of North Texas Denton Texas 33023 11744 0.88 44767 39394
159 1001-1200 University of Texas at Arlington Arlington Texas 30503 13155 0.87 43658 37982
160 1001-1200 University of Texas at El Paso El Paso Texas 20123 3715 0.72 23838 17163
161 1001-1200 University of Texas at San Antonio San Antonio Texas 29112 4707 0.87 33819 29422
162 1001-1200 Brigham Young University Provo Utah 31411 3053 0.91 34464 31362
163 1001-1200 Utah State University Logan Utah 20573 3108 0.94 23681 22260
164 1001-1200 University of Vermont Burlington Vermont 11326 2190 0.92 13516 12434
165 1001-1200 College of William and Mary Williamsburg Virginia 6634 2710 0.94 9344 8783
166 1001-1200 George Mason University Fairfax Virginia 26447 12035 0.81 38482 31170
167 1001-1200 West Virginia University Morgantown West Virginia 18370 5682 0.96 24052 23089
168 1001-1200 University of Wyoming Laramie Wyoming 8363 2582 0.96 10945 10507
169 1201-1400 San Francisco State University San Francisco California 21035 3321 0.70 24356 17049
170 1201-1400 University of San Diego San Diego California 5569 3146 0.81 8715 7059
171 1201-1400 University of San Francisco San Francisco California 5980 3670 0.75 9650 7237
172 1201-1400 University of the Pacific Stockton California 3266 2983 0.79 6249 4936
173 1201-1400 Florida Atlantic University Boca Raton Florida 23074 5401 0.77 28475 21925
174 1201-1400 Central Michigan University Mount Pleasant Michigan 10297 4156 0.95 14453 13730
175 1201-1400 Western Michigan University Kalamazoo Michigan 13264 3411 0.94 16675 15674
176 1201-1400 University of Missouri - St. Louis Saint Louis Missouri 5378 2766 0.96 8144 7818
177 1201-1400 City University of New York - City College New York City New York 11712 0 0.95 11712 11126
178 1201-1400 University of North Carolina at Greensboro Greensboro North Carolina 13862 3780 0.93 17642 16407
179 1201-1400 Cleveland State University Cleveland Ohio 9502 4609 0.93 14111 13123
180 1201-1400 Miami University of Ohio Oxford Ohio 16721 2243 0.96 18964 18205
181 1201-1400 Portland State University Portland Oregon 14299 4747 0.88 19046 16760
182 1201-1400 University of Memphis Memphis Tennessee 14181 5209 0.96 19390 18614
183 1201-1400 Seattle University Seattle Washington 4033 3075 0.86 7108 6112
184 1201-1400 Marquette University Milwaukee Wisconsin 7290 3639 0.92 10929 10054
185 1201-1400 University of Wisconsin-Milwaukee Milwaukee Wisconsin 17076 4328 0.95 21404 20333
186 1201-1400 University of South Alabama Mobile Alabama 8171 4958 0.97 13129 12735
187 1401-1500 California State Polytechnic University - Pomona Pomona California 25080 2322 0.67 27402 18359
188 1401-1500 California State University - Long Beach Long Beach California 32780 6042 0.69 38822 26787
189 1401-1500 California State University - Los Angeles Los Angeles California 22690 3723 0.58 26413 15319
190 1401-1500 Humboldt State University Arcata California 5373 564 0.85 5937 5046
191 1401-1500 Nova Southeastern University Fort Lauderdale Florida 6885 13977 0.71 20862 14812
192 1401-1500 Illinois State University Normal Illinois 18019 2628 0.92 20647 18995
193 1401-1500 Indiana State University Terre Haute Indiana 6926 1693 0.97 8619 8360
194 1401-1500 University of Montana Missoula Montana 6937 2740 0.96 9677 9289
195 1401-1500 University of Central Oklahoma Edmond Oklahoma 10400 1511 0.95 11911 11315
196 1401-1500 Western Washington University Bellingham Washington 13686 946 0.89 14632 13022
"""summary_line
2024 US Presidential Election Results and Top Universities by State
The link below provides the data for the 2024 US Presidential Election Results at the county level.
https://github.com/tonmcg/US_County_Level_Election_Results_08-24/blob/master/2024_US_County_Level_Presidential_Results.csv
https://uselectionatlas.org/RESULTS/national.php?year=2024&off=0&elect=0&f=0
I collected data on the top US universities with a QS ranking below 500.
The data header is as follows:
no,world_rank,institution,country,state
"""
import pandas as pd
import geopandas as gpd
import plotly.graph_objects as go
from plotly.subplots import make_subplots
results_df = pd.read_csv(
'2024_US_County_Level_Presidential_Results.csv'
)
universities_df = pd.read_csv(
'ranking-QS-USA-2025-ALL.csv'
)
# Determine which party won each state
state_winners = results_df.groupby(
'state', group_keys=False
).apply(
lambda x: pd.Series(
{'winner': 'Democrat' if x['votes_dem'].sum() > x['votes_gop'].sum() else 'Republican'}
),
include_groups=False
).reset_index()
# Count the number of top universities in each state
domestic_max = universities_df['domestic'].max()
universities_df['domestic_weight'] = universities_df['domestic'] / domestic_max
university_counts = universities_df.groupby('state')['domestic_weight'].sum().reset_index()
# university_counts = universities_df['state'].value_counts().reset_index()
university_counts.columns = ['state', 'university_count']
# Merge the dataframes to get the winner and university count for each state
state_data = pd.merge(
state_winners, university_counts,
on='state',
how='left'
)
state_data['university_count'] = state_data['university_count'].fillna(0)
# Ensure you have downloaded the Natural Earth dataset
# and extracted it to the 'map_data' directory
us_states = gpd.read_file(
'map_state/ne_110m_admin_1_states_provinces.shp'
)
# Ensure the state names match
us_states = us_states[us_states['name'].isin(state_data['state'])]
# Merge the geometry with our data
merged_data = us_states.merge(
state_data,
left_on='name',
right_on='state'
)
merged_data = merged_data.sort_values('university_count', ascending=True)
# Create color scales for both parties
dem_colors = ['rgba(0, 0, 255, 0.2)', 'rgba(0, 0, 255, 1)'] # Light to dark blue
rep_colors = ['rgba(255, 0, 0, 0.2)', 'rgba(255, 0, 0, 1)'] # Light to dark red
# Create separate figures for Democrats and Republicans
fig = make_subplots(
rows=1, cols=2,
specs=[[{"type": "geo"}, {"type": "xy"}]],
column_widths=[0.6, 0.4],
subplot_titles=("Election Results by State", "Top Universities by State")
)
# Add Democratic states
dem_states = merged_data[merged_data['winner'] == 'Democrat']
if not dem_states.empty:
fig.add_trace(go.Choropleth(
locations=dem_states['postal'],
z=dem_states['university_count'],
locationmode='USA-states',
colorscale=dem_colors,
showscale=False,
text=dem_states.apply(
lambda x: f"{x['name']}<br>Universities: {x['university_count']}",
axis=1
),
hoverinfo='text',
name='Democrat'
), row=1, col=1)
# Add Republican states
rep_states = merged_data[merged_data['winner'] == 'Republican']
if not rep_states.empty:
fig.add_trace(go.Choropleth(
locations=rep_states['postal'],
z=rep_states['university_count'],
locationmode='USA-states',
colorscale=rep_colors,
showscale=False,
text=rep_states.apply(
lambda x: f"{x['name']}<br>Universities: {x['university_count']}",
axis=1
),
hoverinfo='text',
name='Republican'
), row=1, col=1)
# Add bar chart for university counts
colors = ['blue' if winner == 'Democrat' else 'red' for winner in merged_data['winner']]
fig.add_trace(
go.Bar(
x=merged_data['university_count'],
y=merged_data['name'],
orientation='h',
marker_color=colors,
text=merged_data['university_count'].astype(float).round(2),
textposition='auto',
name='Universities',
hovertemplate="%{y}<br>Universities: %{x}<br>Winner: %{customdata}<extra></extra>",
customdata=merged_data['winner']
),
row=1, col=2
)
# Update the layout
fig.update_layout(
title={
'text': '2024 Presidential Election Results and Top Universities (QS Ranking) and their size by State',
'y': 0.95,
'x': 0.5,
'xanchor': 'center',
'yanchor': 'top'
},
geo=dict(
scope='usa',
showlakes=True,
lakecolor='rgb(255, 255, 255)',
projection_scale=1.1,
domain={'x': [0, 0.5], 'y': [0, 1]}
),
height=1200,
width=1800,
showlegend=False,
barmode='stack'
)
# Show the figure
fig.show()